A Software Demo for Modelling CKD and Detecting AKI
Caption: Modelling CKD and detecting at the same time.
- About this demo
- The algorithms implemented
- Demo
- What makes the software unique?
- What’s next?
- Cite this blog
About this demo
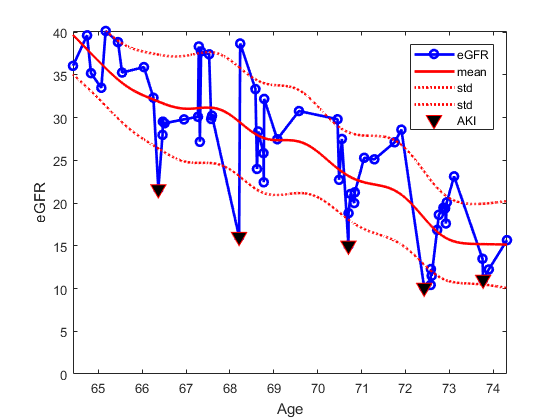
Within the context of the MRC Modelling CKD Progression project, we have developed a piece of software which attempts to model the long-term kidney function in terms of estimated Glomerular Filtration Rate (eGFR) as well as the short-term trend, specificaly for detecting Acute Kidney Injury (AKI).
I like to describe the long-term Chronic Kidney Disease (CKD) trend as similar to climate whereas the short-term trend as akin to weather. Climate is a long-term overage of weather, the latter of which fluctates instantaneously. The fluctuation in kidney function can be due to food intake such as a high-protein meal, a patient recovering from a major event such as an amputation surgery, or simply dehydration which may disrupt the body’s ability to clear creatinine. Indeed, eGFR is a quantity that is estimated based on the amount of creatinine concentration; and is a surrogate marker for the actual Glomerular Filtration Rate (GFR). Being able to distinguish signals from noise, i.e, recognising the real kidney function despite the natural fluctuation, is key to managing patients with CKD.
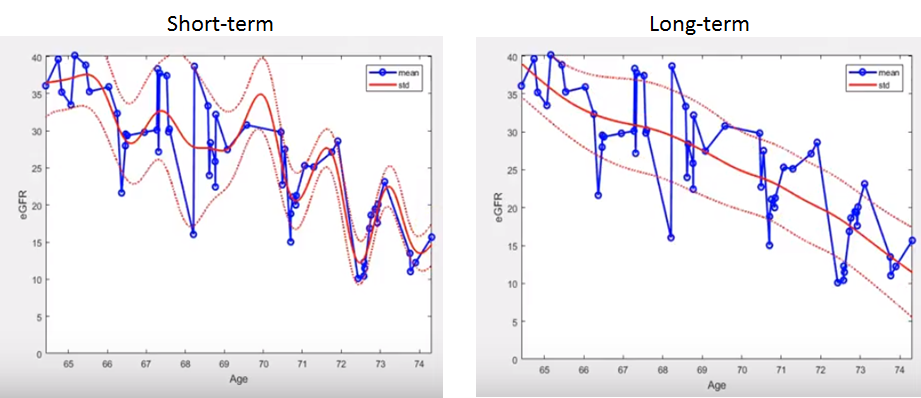
The diagram above shows how an algorithm called probabilistic broken-stick model can model both the short and long-term conditions. The short-term trend is parameterised by an observation window of 1 year, moving at a step-size of every 3 months whereas the long-term trend is parameterised by a window of 2 years, moving at a step-size of 1 year. These parameters can be changed as desired.
The algorithms implemented
The software demo below demonstrates how CKD and AKI can both be detected. Three algorithms have been implemented, namely:
- Probabilistic broken-stick model: for modelling the long-term CKD progression
- SAKIDA: Surrey AKI Detection Algorithm
- NHS: The NHS algorithm for AKI detection
All of these algorithms work with eGFR. The software, however, can take a creatinine time-series and apply the relevant formulas to obtain the corresponing eGFR time-series, such as:
-
MDRD GFR: This is the Modification of Diet in Renal Disease (MDRD) Study equation. The resultant eGFR that is calculated has variance (standard error) that is larger for hight GFR values. So, it is not suitable for healthy subjects who generally have high GFR value. The Creatinine can be recorded in micro mol per litre (µmol/L) or miligram per decilitre (mg/dL); and we have implemented both.
-
CKD-EPI: This is the Chronic Kidney Disease Epidemiology Collaboration study equation, which supercedes the MDRD GFR equation.
-
eGFR: Of course, the software will happily take eGFR if you prefer to supply pre-calculated eGFR values.
The demo
Here’s a demo of the software.
What makes the software unique?
- model CKD and detect AKI at the same time, as shown above, giving clinicians a complete view of the software
- load the creatinine and convert the time series using different equations
- load eGFR time series directly
- process and annotate many patient records
Download and install the software
To download the software, go to this page.
The software here is in ‘demo-mode’ and is meant for your own use. If you look to deploy it, for example, on a large database of patients, please do get in touch with me. I will be thrilled to hear from you.
Cite this blog post
Bibtex
    @misc{ poh_2018_01_15_ckd-aki-demo,
      author = {Norman Poh},
      title = { A Software Demo for Modelling CKD and Detecting AKI },
      howpublished = {\url{ http://normanpoh.github.com/blog/2018/01/15/ckd-aki-demo.html},
      note = "Accessed: ___TODAY___"
    }