Tutorial: Using NIST Fingerprint software to generate a pairwise comparison score matrix
Purpose
In this tutorial, you will learn about how to work with a fingerprint database to the point where you can generate relevant performance curves and metrics such as equal error rate.
- a fingerprint database. Download the LivDET 2011 database.
- the NIST Biometric Image Software (NBIS)
- In my setup, I have a host Windows machine and run Ubuntu 16.04 using VMWare. If you use this setup, you should read my previous post which sets up the environment correctly. You can, of course, use VirtualBox to achieve the same result; or even mix the two, e.g., create VMWare image and then run it in VirtualBox.
- For performance, you should get the git clone the
werfunction usinggit clone git@gitlab.com:normanpoh/DETconf_octave.gitor else visit this link.
Once you have fulfilled the above requirements, you can then follow the instructions set out below.
I will be using a combination of bash and Octave scripts in order to plot the performance curves. Once you understand how this works, you can, of course, use different biometric software and modalities.
Intended audience
I have written this tutorial for researchers who are interested to start working in biometrics but are not fully confident with using bash and Octave or Matlab. With this in mind, every step has been carefully written so that they can follow, whilst learning the strengths or features that the scripts can offer.
Procedure
We shall use a publicly available fingerprint database to illustrate how you can use NIST’s fingerprint matching bozorth3 to generate an exhaustive pair-wise comparison score matrix.
- The folder in which all fingerprint images are stored is
/mnt/hgfs/C/Users/np0004/Documents/LivDET/data/2011/TrainingItaldataLive. - NIST’s fingerprint software has been installed properly and all the binary execution files are configured in the file
.bashrc.
1.Configure the directories.
You should replace fdir (which contains fingerprint images) and outdir which is the output (where fingerprint features will be stored) with your appropriate directories.
# In bash:

# Set the input file directory where all the fingerprint images in .png format are stored. In my case, they are stored in; yours will certainly be different
fdir=/mnt/hgfs/C/Users/np0004/Documents/LivDET/data/2011/TrainingItaldataLive

# Set the output directory where features are stored
outdir=features

# Set the file list variable
flist=filelist.txt

# List all the files and store them in $file
ls $fdir > filelist.txt #List all the files

# Create the output directory
mkdir $outdir
2.Extract the features
To extract the features, below I assume that the fingerprint images are stored in .png format; so the command convert is used to convert the images to .wsq. The code below simply loops through all the files and extract the fingerprint features using NIST’s mindtct program.
# In bash:
c=0
tot=`wc -l $flist`
for m in `cat $flist`
do
  ((c++))
  fname=`basename $m .png`
  echo "Processing file no $c of $tot: $fname"
  convert $fdir/$m out.wsq
  mindtct out.wsq $outdir/$fname
done
All the features can now be found in the directory $outdir (i.e., features in the example above).
To check the output, type ls features/*.xyt | head. The database contains <user-id>_<attempt-id>.png; so the processed output contains <finger-id>_<attempt-id>.xyt. There are 200 unique fingers and for each finger, there are 5 attempts; so thare are a total of 1000 fingerprint images.
features/100_1.xyt
features/100_2.xyt
features/100_3.xyt
features/100_4.xyt
features/100_5.xyt
features/101_1.xyt
features/101_2.xyt
features/101_3.xyt
features/101_4.xyt
features/101_5.xyt
3. Generate the score matrix in Octave
We could use ls features/*.xyt > filelist_xyt.txt but then the output is not ordered. So, instead, we shall manually create the list of filenames in Octave, as follows.
% In Octave
c = 0;
for u=1:200 %there are 200 unique fingers
  for i=1:5 %each having 5 fingerprint impressions
    c=c+1;
    fname{c} = sprintf('features/%d_%d.xyt', u, i);
  end
end

%% write to file
fid= fopen('filelist_xyt.txt', 'w');
cellfun(@(x) fprintf(fid, '%s\n', x), fname);
fclose(fid);
Let’s write two functions to get the user and session indices, respectively. These 2 pieces of information are often needed in order to extract genuine and impostor scores as will become clear later.
In order to extract the information, I have chosen to achieve this by processing the filenames in order to illustrate how you can use text processing in Octave. In practice, you should modify the scripts to suite your needs.
Recall that each role in the filelist_xyt.txt has the following format: features/
%% Let's process the user
function out = get_user(x)
  out_ = strsplit(x, '/');
  out_ = strsplit(out_{2}, '_');
  out = str2double(out_{1});
endfunction
Using the same methodology, we create the get_session function.
function out = get_session(x)
  out_ = strsplit(x, '/');
  out_ = strsplit(out_{2}, '_');
  out_ = strsplit(out_{2}, '.');
  out = str2double(out_{2});
endfunction
Here’s how you apply the function.
for i=1:numel(fname)
  user(i) = get_user(fname{i})
end
Writing the for loop is not usually a very efficient way of doing this. Since the variable fname is a cell type, we can use the cellfun and then further define an annonymous function applied to each cell. In our case, this function is @(x) get_user(x) which reads, apply each cell x using the function get_user`’.
user = cellfun( @(x) get_user(x), fname, "UniformOutput", true);
session = cellfun( @(x) get_session(x), fname, "UniformOutput", true);
The variable user will be used later to distinguish between genuine and impostor scores.
Next, we use bozorth3 to compare a template with a list of gallery images. Since we are perform exhausitve pair-wise comparisons, we take each of the image in the list and compare it with the list of gallery images. This process is repeated for each fingerprint template in the list.
scores = zeros(1000,1000);

for i=1:numel(fname)
  cmd = sprintf("bozorth3 -o out.scores -p %s -G filelist_xyt.txt", fname{i});
  tic;
  msg = unix(cmd);
  scores_ = dlmread('out.scores');
  scores(:,i) = scores_;
  time_ = toc;
  fprintf(1, '%d of %d (%1.2f)\n', i, numel(fname), time_); fflush(stdout);
end

%Save the scores.
save scores.mat scores
Well, it is possible to parallelize the process above so you can use all the CPU cores. Refer to this link to find out more.
Let us now plot the score matrix of 100x100 out of 1000x1000 so we can see in details how the scores look like.
%% load scores
load scores.mat scores
axis([0.5 100.5 0.5 100.5]) %Just to plot the first 100x100 matrix out of 1000x1000
imagesc(scores)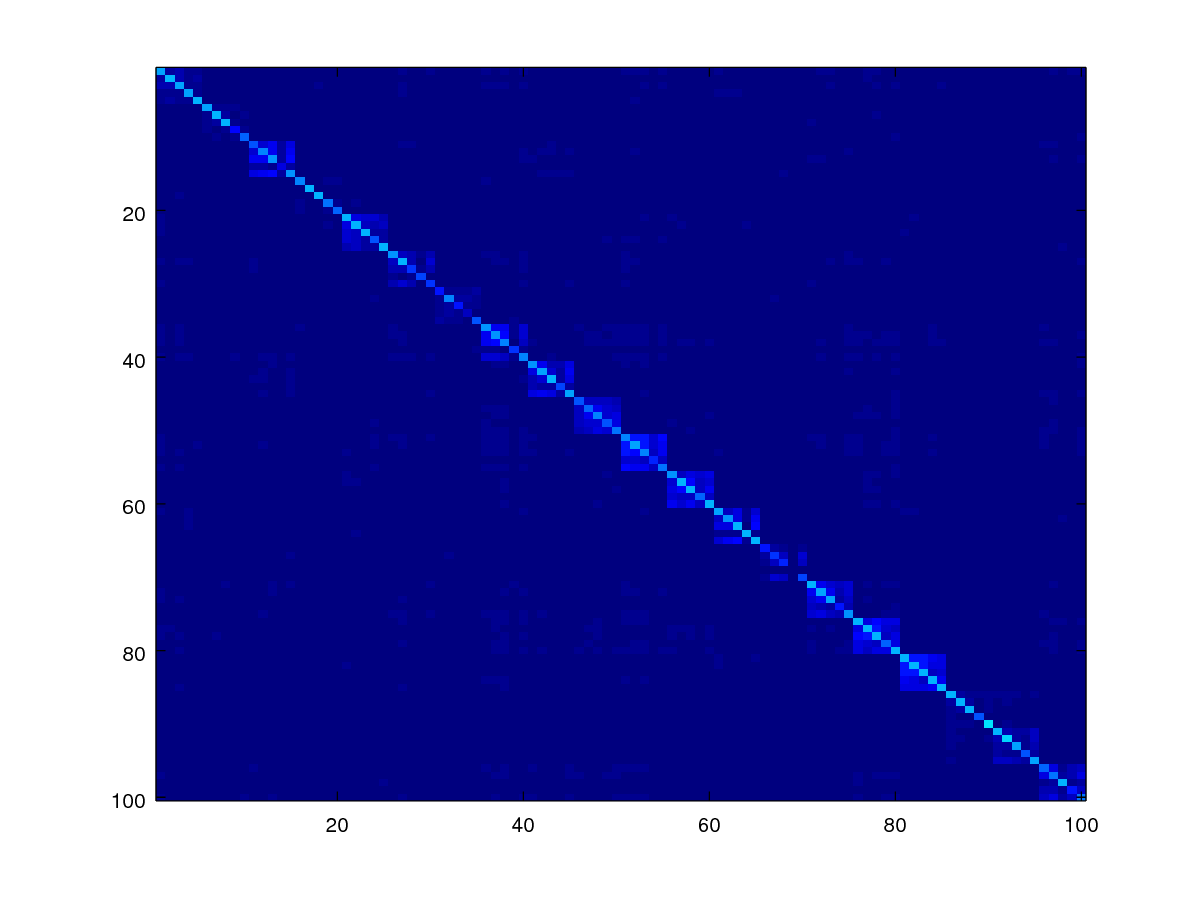
As can be observed, the scores appear in blocks forming the diagonal where the genuine scores are expected to be there.
Since the diagonal of the matrix are comparisons due to the same image, we should ignore them by setting them to zero. The code below does this by using a mask.
mask = 1- eye(numel(fname));
scores1 = scores .* mask;
imagesc(scores1)
axis([0.5 100.5 0.5 100.5]);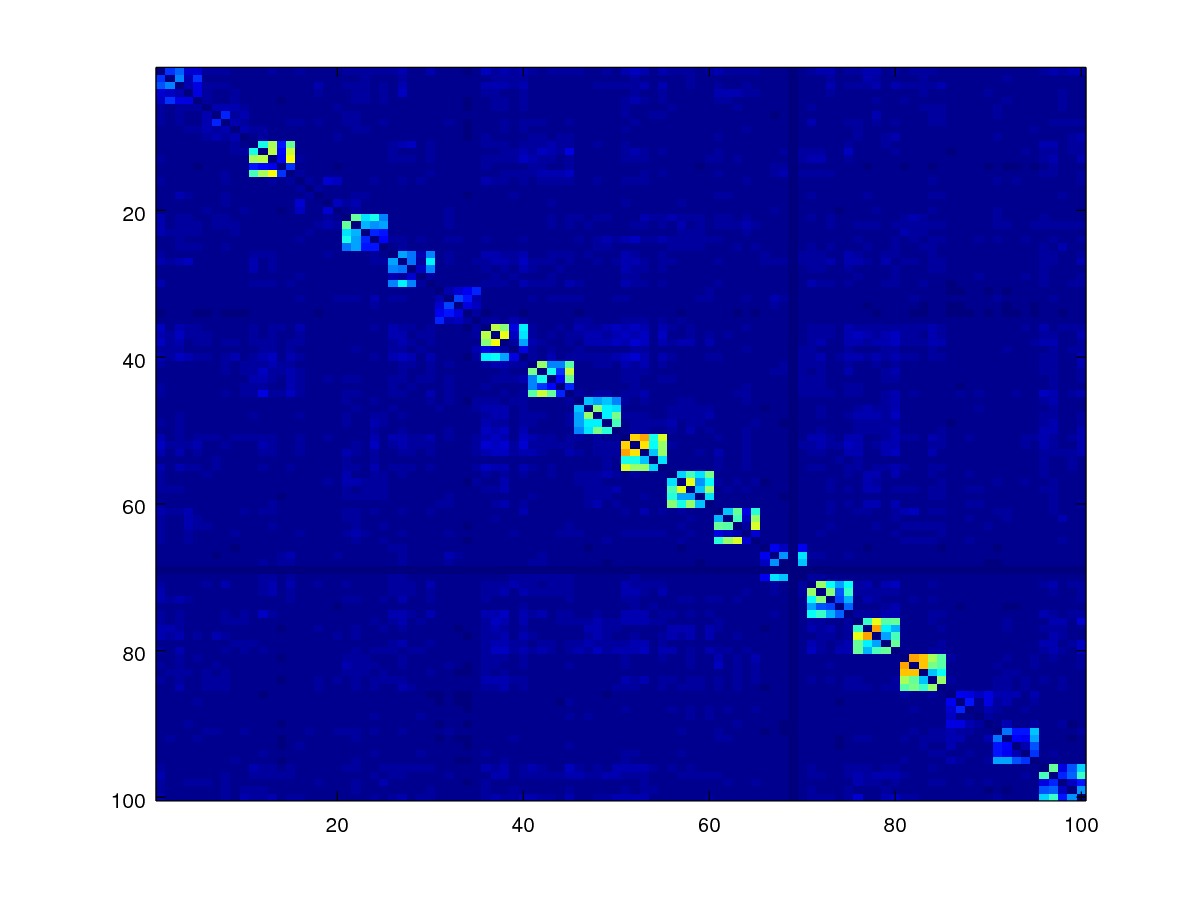
Minutiae-based similarity scores are not symmetrical but really they should since comparing samples A and B should be the same as comparing B and A. To enforece this property, we can use codes below, which take the upper triangular matrix of the scores and add it to the transposed version of the lower triangular matrix, and then take the average of the two.
scores_sym = 0.5 * (triu(scores1) + tril(scores1)');

% now display
imagesc(scores_sym)
axis([0.5 100.5 0.5 100.5]);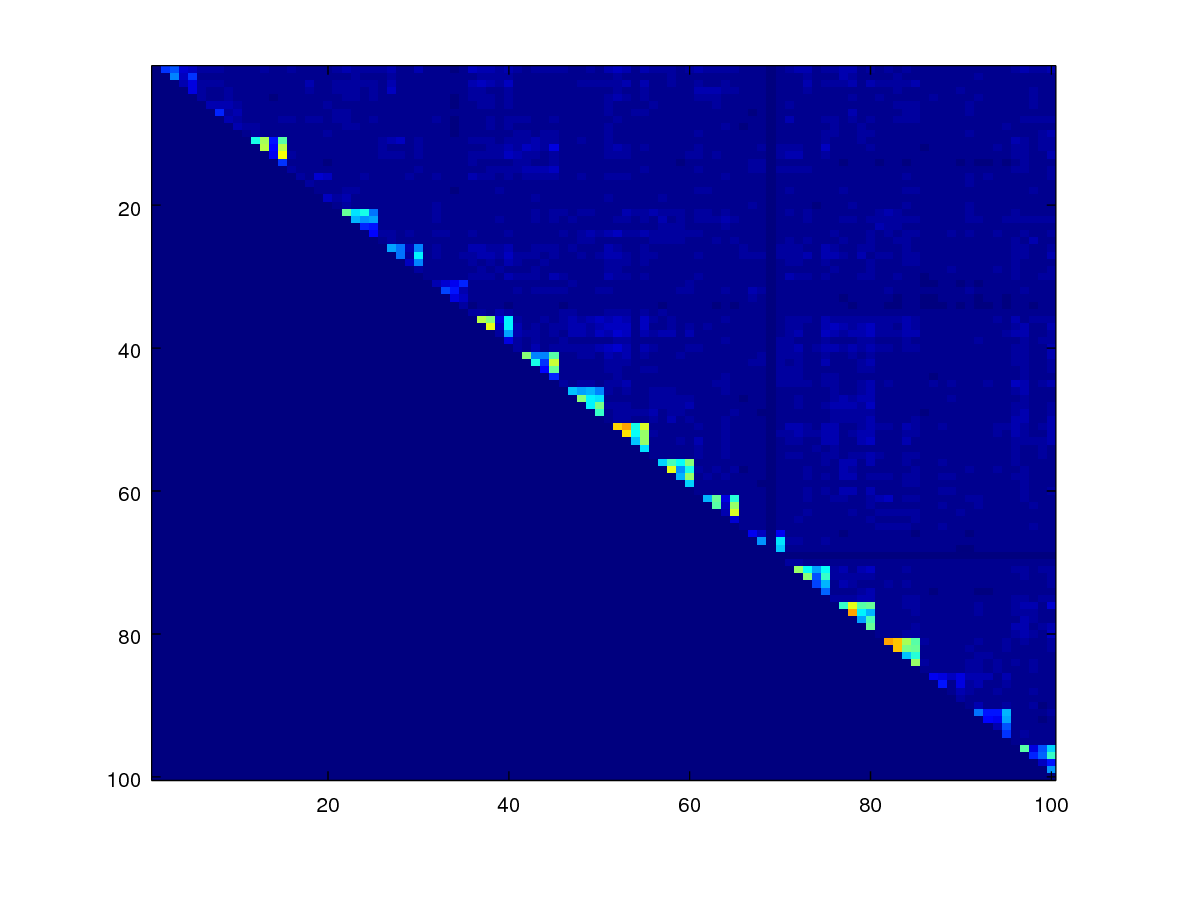
Because of the above matrix operations (triu and tril), the lower triangular matrix has zero values everywhere.
We can create a function get_symmetric_scores to do this.
function scores_sym = get_symmetric_scores(scores, idlist)
  mask = 1- eye(numel(idlist));
  scores1 = scores .* mask;
  scores_sym = 0.5 * (triu(scores1) + tril(scores1));
endfunction
Now, we create the mask for the genuine scores.
idlist = user;

mask_gen=zeros(size(scores));
for id=unique(idlist),
  selected = idlist==id;
  mask_gen(selected,selected)=1;
end;

mask_gen = mask_gen - eye(numel(fname));
mask_gen = triu(mask_gen);
imagesc(mask_gen);
axis([0.5 100.5 0.5 100.5]);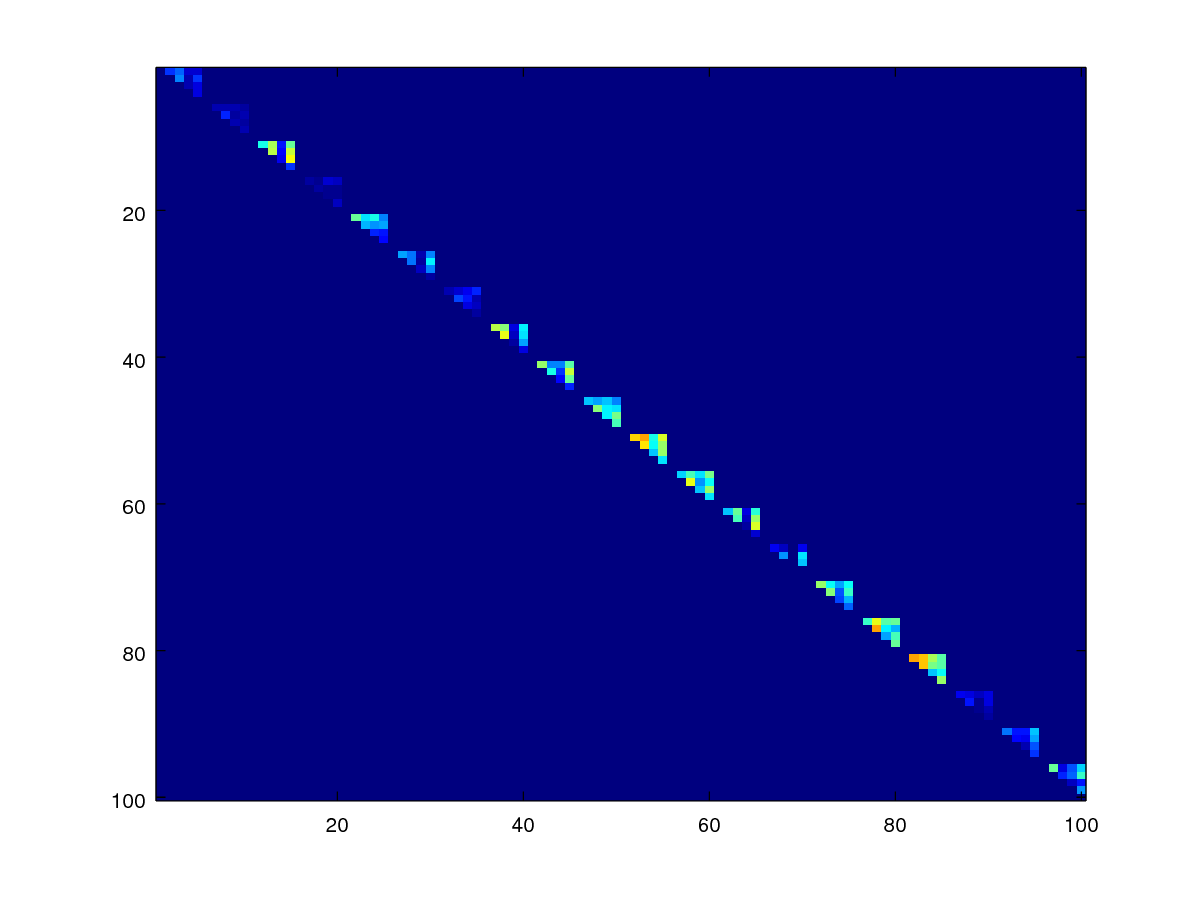
Do the same for the impostor score mask.
mask_imp = ones(size(mask_gen)) - mask_gen - eye(numel(fname));
mask_imp = triu(mask_imp);
imagesc(mask_imp)
axis([0.5 100.5 0.5 100.5]);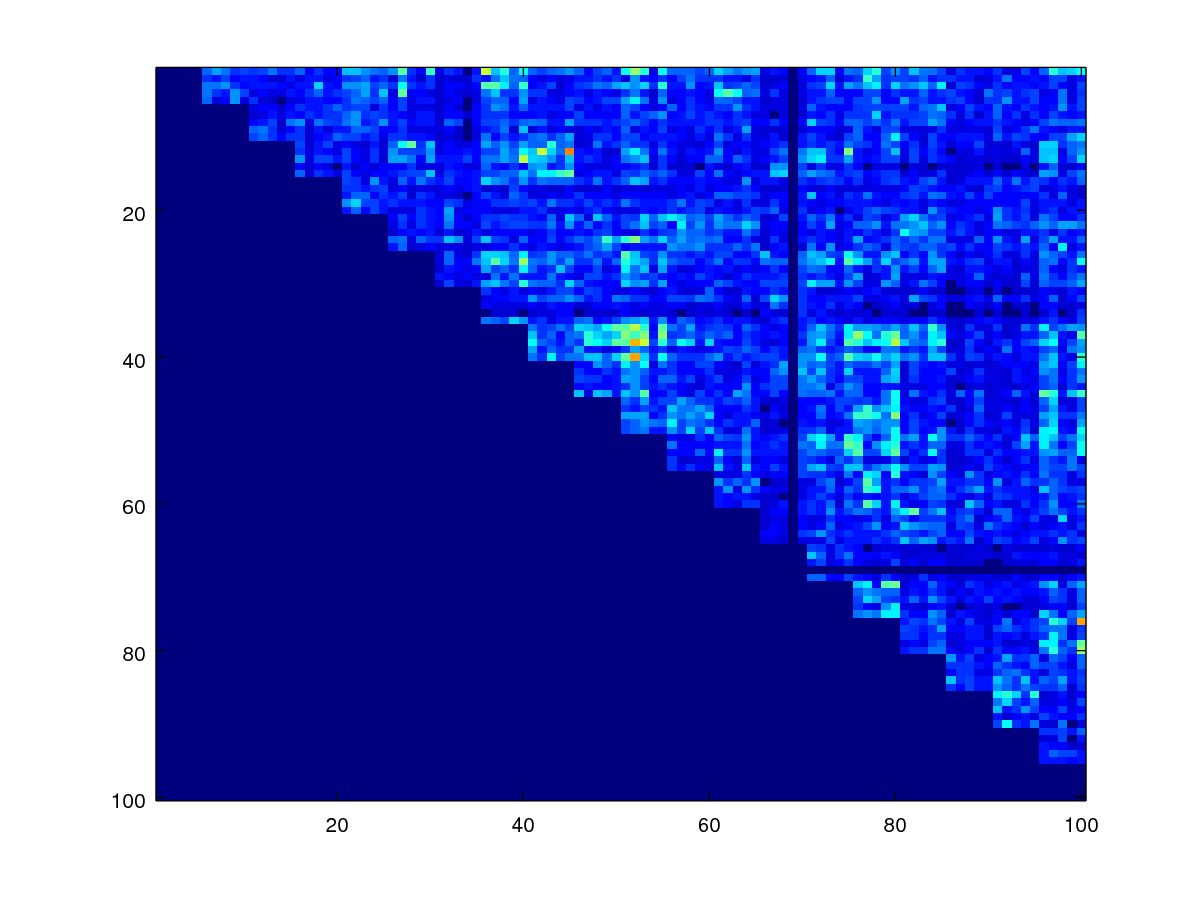
We can observe that the genuine scores and impostor scores are occupying different parts of the original score matrix. Next we shall use the masks created to get the imp_scores and gen_scores.
%% get the genuine scores
imagesc(mask_gen .* scores_sym)

%% get the impostor scores mask
imagesc(mask_imp .* scores_sym)

%% get the scores
imp_scores = scores_sym(mask_imp==1);
gen_scores = scores_sym(mask_gen==1);
Since we are going to apply a series of masks to get to the imp_scores and gen_scores, we might as well write a function for this. Let’s call this get_scores.
function [imp_scores, gen_scores] = get_scores(scores, idlist)

  mask_gen=zeros(size(scores));
  for id=unique(idlist),
    selected = idlist==id;
    mask_gen(selected,selected)=1;
  end;

  mask_gen = mask_gen - eye(numel(idlist));
  mask_gen = triu(mask_gen);
  %imagesc(mask_gen);

  %% prepare the impostor score mask
  mask_imp = ones(size(mask_gen)) - mask_gen - eye(numel(idlist));
  mask_imp = triu(mask_imp);
  %imagesc(mask_imp)

  %% get the genuine scores
  %imagesc(mask_gen .* scores_sym)

  %% get the impostor scores mask
  %imagesc(mask_imp .* scores_sym)

  %% get the scores
  imp_scores = scores(mask_imp==1);
  gen_scores = scores(mask_gen==1);

endfunction
In the above code, scores(mask_imp==1) selects the elements in the score matrix where the mask_imp is true. This conveniently returns a column vector of impostor scores which is the formwat we need. Recall that scores is a score matrix; and not a column vector but by using the subsetting operation scores(mask_imp==1) returns a column vector. So the matrix has been linearlised implicitly.
Having obtained the genuine and impostor score vectors, we can now plot the performance using the wer function, which gives us the equal error rate (EER) of the system.
%% plot the error rate curve
addpath ../Lib/DETconf/lib/
pkg load statistics optim econometrics

eer = wer(imp_scores, gen_scores,[],1);
fprintf(1,' Equal Error Rate is %1.2f percent', eer*100);
The above codes generate the figure below.
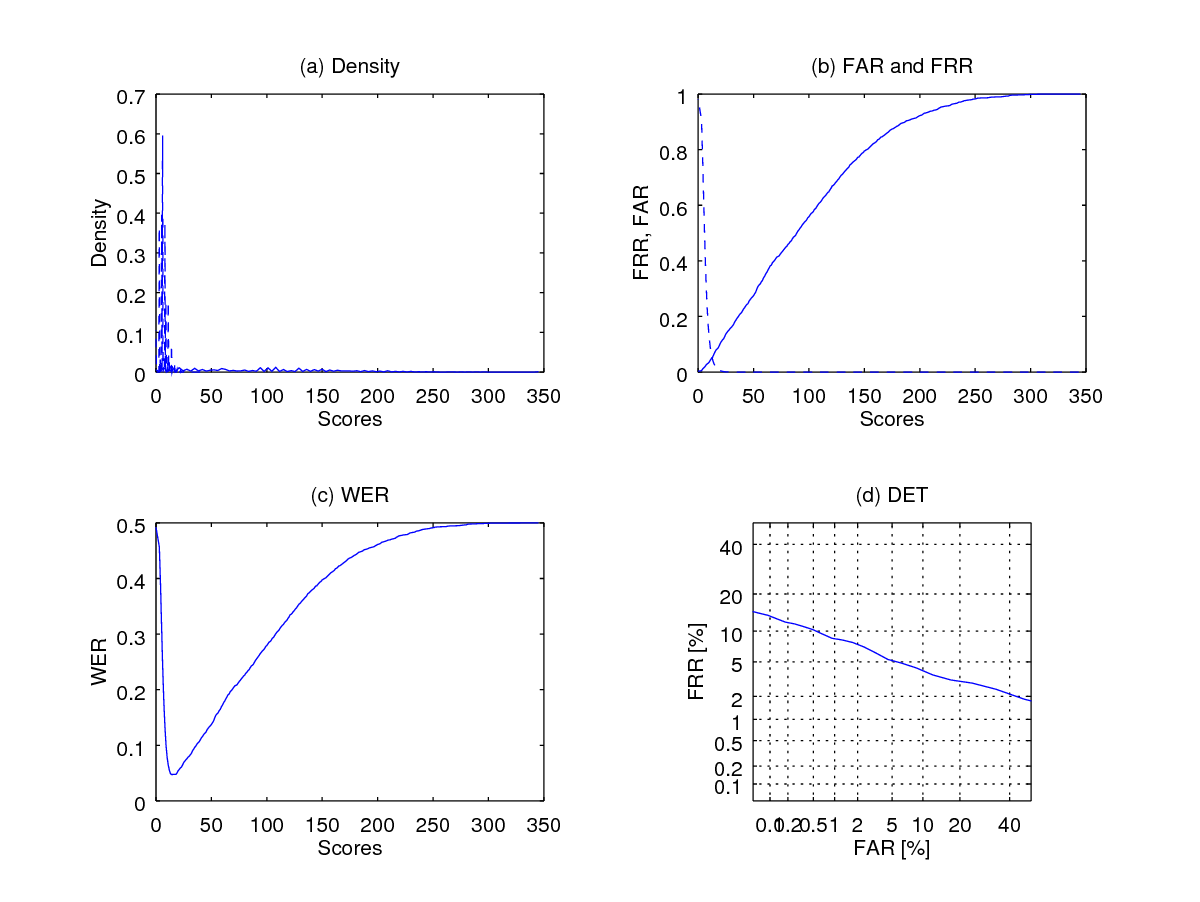
Note that using option 1 as in wer(imp_scores, gen_scores,[],1) can be terribly slow because of the use of kernel density function which was used to generate the upper-left corner plot below (figure (a)). This plot shows the density of the scores, with the continuous line showing the distribution of the genuine scores and the dashed line indicating the impostor score distribution. Figure b shows the False aceptance rate (FAR) curve in dashed line and False rejection rate (FRR) in continuous line. (c) shows the Weighted error rate (WER) curve which is defined as the average of FAR and FRR:
In order to visualize the score distributions, we can use generalised linear transform; which is defined as: where and are the lower and upper bounds of the score, respectively.
We see that the generalised logit transform as computed below may result in -Inf due to ; and this happens when or . So, if we deal with fingerprint minutiae-based system, we should not set but ; and so as its uppper bound which is to be set to a sufficiently large number by trial and error.
It is implemented using the function below logit_transform function below.
function output= logit_transform(scores, max_scores)
  if nargin<2,
    max_scores=400;
  end
  output = log(scores + 1) - log(max_scores - scores); %we add one to avoid -Inf
endfunction
where
is the maximum value the fingerprint similarity score $y$. We can set this to be slightly larger than the maximal observable score, which is 400 in this case. We then apply the function to the genine and impostor scores and then replot the performance curves using wer.
imp_logit = - logit_transform(imp_scores, 400);
gen_logit = - logit_transform(gen_scores, 400);

tic;
eer = wer(imp_logit, gen_logit,[],1);
toc

print('-dpng', 'Pictures/wer2_logit.png');
fprintf(1,' Equal Error Rate is %1.2f percent', eer*100);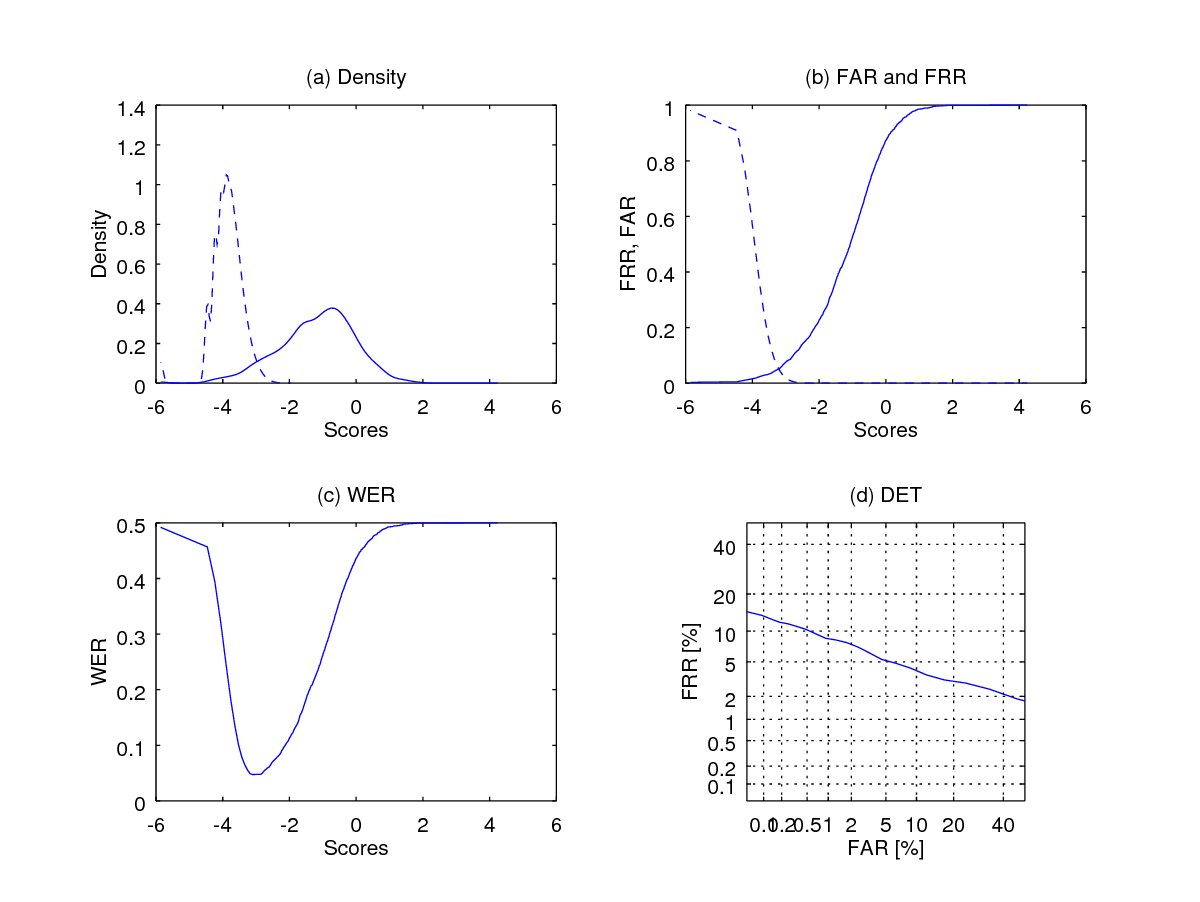
As can be observed the score distributions look a lot more sensible but the performance should remains the same. Why? Because the generalised logit transform operator is a one-to-one order-preserving transformation, i.e., the orders of the scores before and after the transformation does not change.
Summary and where do you go from here
In short, this tutorial shows you how to work with NIST’s bozorth3 software to generate scores which you can then analyse using the wer function in order to plot the system performance.
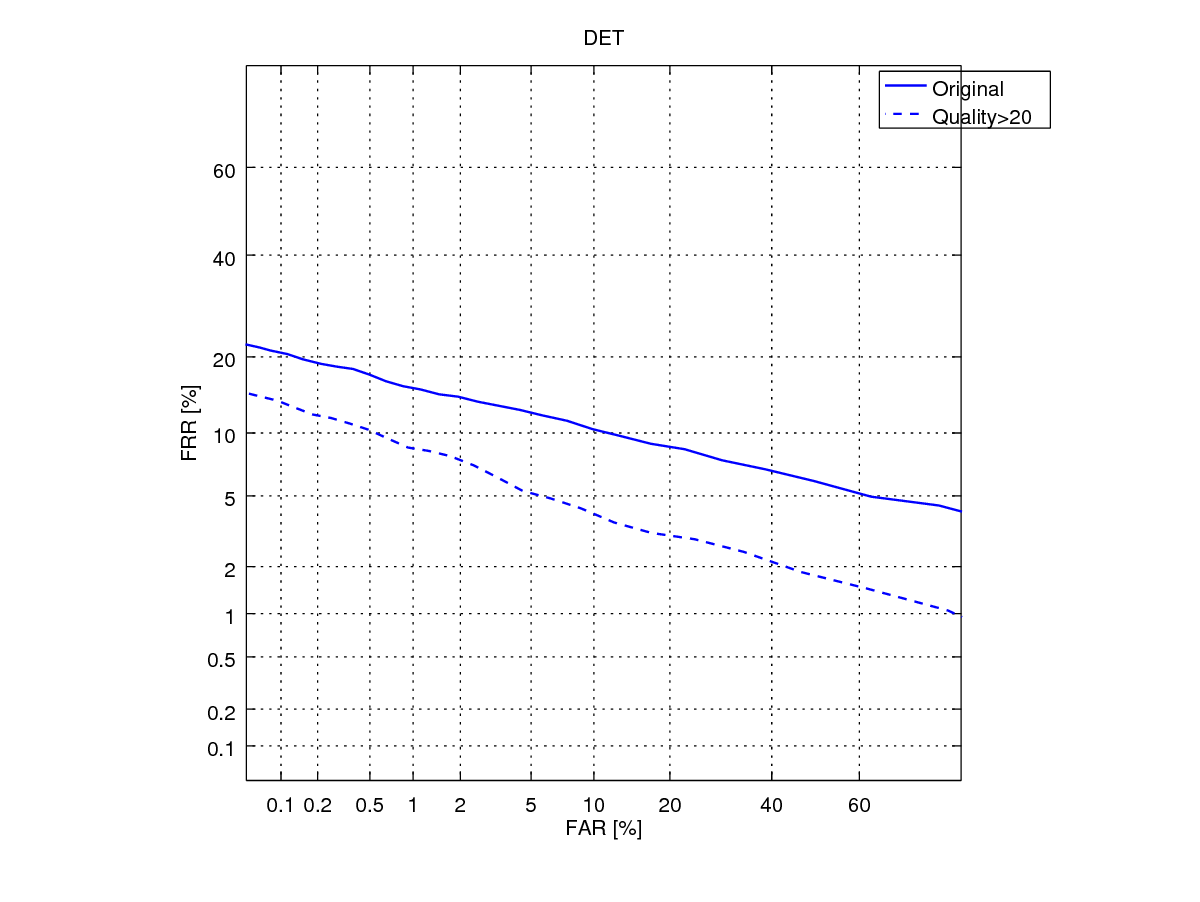
In the next tutorial, I will show you how to optimize the system performance by adjusting the fingerprint minutia quality. The DET curve below shows the performance gain we could obtain if we retain only the minutiae with sufficiently high quality.
In addition, on reflection, you may have noticed that we have used all samples in a database to generate the genuine and impostor scores. So, if there are users and each has samples, then a total of matching is needed (ignoring the symmetrised score operation). If we deal with millions of users, this can not only be prohibitive large, but also that the proportion of impostor scores relatively to the genuine scores becomes very disporportionate. You may also be interested in an alternative biometric experimental protocol that can deal with this situation.
Cite this blog post
Bibtex
    @misc{ poh_2017_12_29_generate-pairwise-fprint-scores,
      author = {Norman Poh},
      title = { Tutorial: Using NIST Fingerprint software to generate a pairwise comparison score matrix },
      howpublished = {\url{ http://normanpoh.github.com/blog/2017/12/29/generate-pairwise-fprint-scores.html},
      note = "Accessed: ___TODAY___"
    }