Using Machine Learning to Model the Progression of Chronic Kidney Disease: A Case Study
This was part of my presentation made in Leeds, 2018. This blog provides more information about my slides.
- Context
- Finding Patients with Drastic Decline in CKD
- Stratify Patients at Point of Care by Their CKD Stage and Progression
- Demonstrating Three Common Machine Learning Tasks: Automatic CKD Trend Classification and Patient Clustering
- Computer Vision - Machine Learning Applied to Imaging
- Cite this blog
Context
Like many domains, the healthcare resource utilisation is not evenly distributed; but follows the Pareto principle, also known as the “80/20 rule”. Unsurprisingly, the majority of healthcare resource utilisation are consumed by few. These patients often have multimorbidities such as diabetes, CVD, CKD, etc. If they have mental health conditions, then their outcome is almost invariably worse than those who don’t.
Here, we pick chronic kidney disease, or CKD, as a case study and an example of a long term condition.
According to a 2012 kidney care study published in Nephrology Dialysis Transplantation, CKD was estimated to cost £1.5 billion or 1.3% of all NHS spending in 2009-2010. More than half were spent on renal replacement therapy. So, preventive care, i.e., keeping CKD patients as healthy as possible is key to maintaining high quality of life-years.
Acknowledgements: The results reported in this blog are made possible thanks to a funding from the Medical Research Council awarded to Norman under its Investigator Research Grant scheme when he was with the University of Surrey. An overaching objective of this project was to find an innovative way to objectively measure CKD progression.
Finding Patients with Drastic Decline in CKD
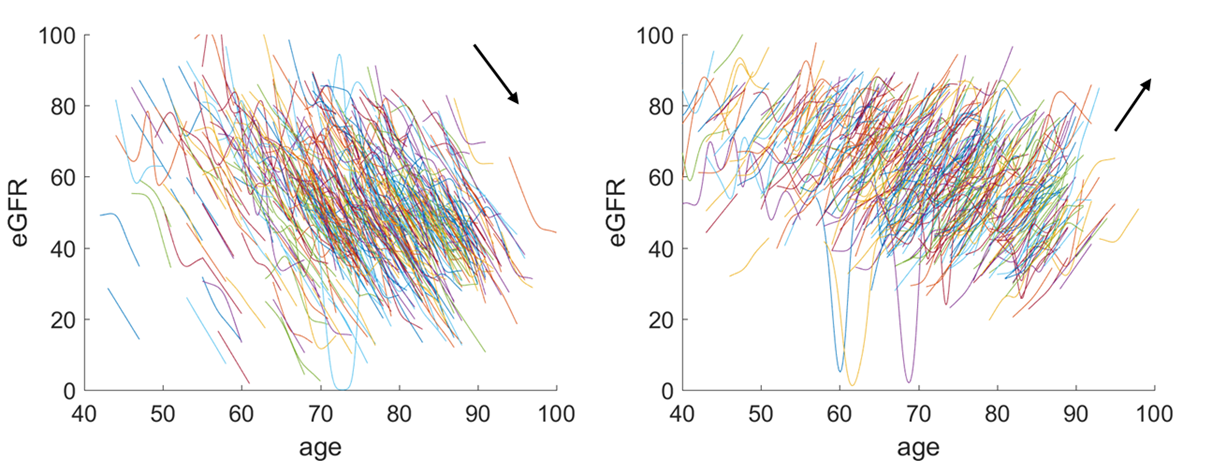
The figure above shows 2 contrasting clusters of eGFR trends. eGFR (the Y-axis) stands for estimated Glomerular Filtration Rate. It is a measure of the kidney efficiency. X is the age, so CKD patients are typically range from the age of 40 until 100. The above diagram is the result of a systematic anlaysis of the eGFR trend, produced by using a clustering algorithm. We have divided some 20,000 patients into 16 clusters with various degrees of CKD progression. We have shown here the trends of the first and last cluster of these CKD patients. It is obvious that the first cluster, as shown above is qualified to be labelled as drastic CKD progression. This is only possible if we have used advanced machine learning methods – the ones that are robust of local fluctuation, which is adapted to identifying signal from noise.
Stratify Patients at Point of Care by Their CKD Stage and Progression
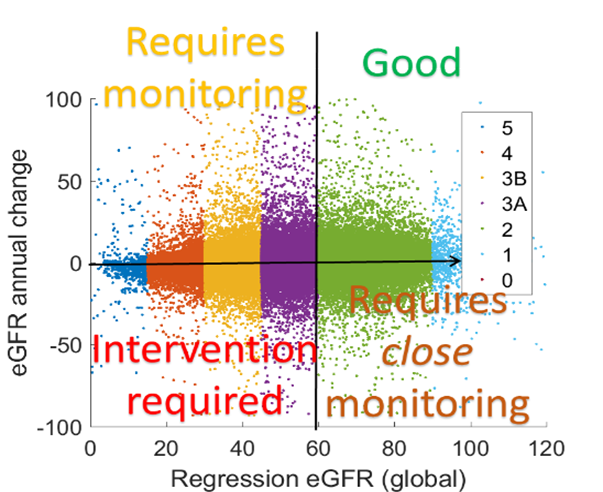
eGFR is used by clinician to define disease stages, with lower being worse and higher being healthy. If we plot this on the X-axis and then plot the eGFR annual rate change, again estimated using regression in the Y-axis, then we can stratify patients now by not only their disease stage but also by their progression. Therefore, CKD can better be managed by using regression – a machine learning method.
The regression algorithm that we have used here is a state-of-the-art algorithm known as a probabilistic broken stick model; but this is not part of the scope of this talk.
Demonstrating Three Common Machine Learning Tasks: Automatic CKD Trend Classification and Patient Clustering
We have seen regression which is one of the most common machine learning tasks; the others are classification and clustering, as shown below.

In the above left diagram, we show how trends can be classified into three different classes, namely, progressive linear, stable and progressive step-wise. If these are done by hands, labelling 2000 patients would take more than a day; but using machine learning, this can be done in a matter of minutes, with an accuracy comparable to human.
If we take all historical clinical medical records of CKD patients, and apply some feature extraction and dimensionality reduction algorithms, we can then start clustering patients by their trajectory, as shown on the right diagram above. This is different from the current established way for classifying patients by disease stages; because we are putting patients with similar “disease trajectory” together. This is a novel way of clustering patients, leading to potentially more tailored treatment regime and potentially even better estimation of the risk of progressive CKD.
Computer Vision - Machine Learning Applied to Imaging
Last but not least, machine learning is also used to process images, a field known as computer vision. The figure below shows how we apply a modified algorithm of Dynamic Mode Decomposition, which was developed in the field of Computational Field Dynamics, to processing MRi images of kidney captured when the organ is under perfusion. Here, DMD was used to stablise an image. This used to be difficult problem but can be solved easily using DMD, without the need to annotate each image in the sequence, which is extremely time consuming. This is an illustration of how computer vision which relies on machine learning, can accelerate clinicians’ workflow from hours to minutes.
What’s next?
Find out more about other kidney research blogs here.
Cite this blog post
Bibtex
    @misc{ poh_2018_01_18_nhs-presentation,
      author = {Norman Poh},
      title = { Using Machine Learning to Model the Progression of Chronic Kidney Disease: A Case Study },
      howpublished = {\url{ http://normanpoh.github.com/blog/2018/01/18/nhs-presentation.html},
      note = "Accessed: ___TODAY___"
    }